Is July really a bad month for stocks?
2025-07-25
While having lunch with my mom in Idaho, I overheard someone at the table next to us say that July tends to be a down month for stocks. This seemed strange. If a month is predictably slow, there should be an opportunity to profit until that opportunity, and predictability, disappears. I decided to test this claim with Daggy.
Although our table neighbor never mentioned any particular stock, I pulled SPY data (which tracks the S&P 500) from January 2010 to December 2024. I defined monthly return as the percentage change from the stock's opening value on the first day of the month to the close on the last day.
I then opened Claude and asked for average returns and standard deviations. It returned the following table:
It returned the following table:
| Month | Mean Monthly Return (%) | Std Dev of Monthly Return (%) |
|---|---|---|
| Jan | 0.65 | 4.17 |
| Feb | 1.11 | 3.71 |
| Mar | 1.17 | 4.54 |
| Apr | 1.48 | 5.24 |
| May | 0.09 | 4.06 |
| Jun | 0.71 | 4.01 |
| Jul | 2.76 | 3.00 |
| Aug | -0.58 | 3.86 |
| Sep | -0.76 | 4.26 |
| Oct | 2.03 | 4.85 |
| Nov | 3.08 | 2.98 |
| Dec | 0.35 | 3.99 |
I then asked it to build me a chart of this data that I could download as a png. It, uh, complied.
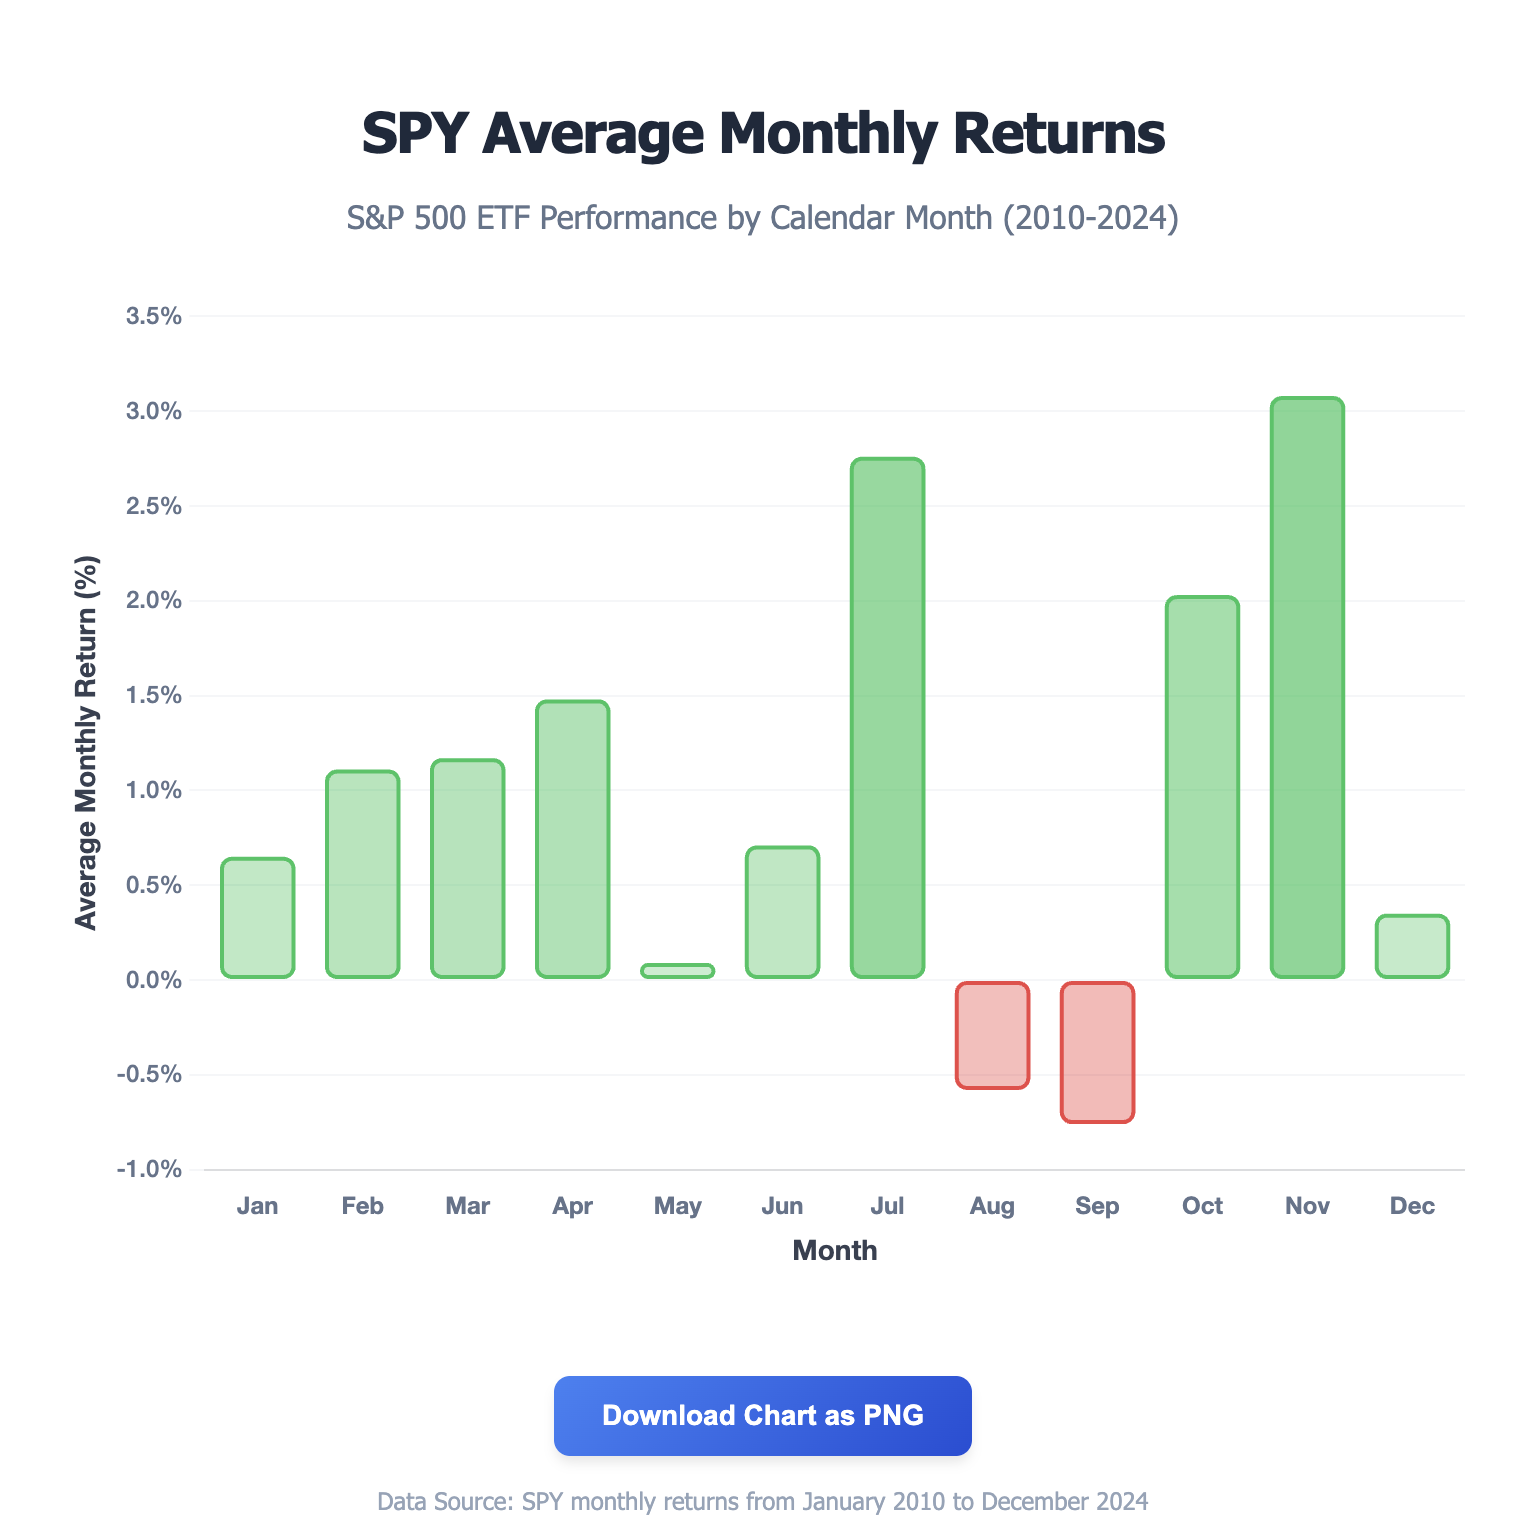
Rather than being down, July is the second strongest month. But the table above shows the standard deviations are often larger than the means themselves, suggesting there's substantial unexplained variation. This variation could be driven by systematic factors—year effects like COVID's 2020 fluctuations, 2022's doldrums, momentum from previous months, or other factors. With Daggy we can easily build statistical models that account for these other factors.
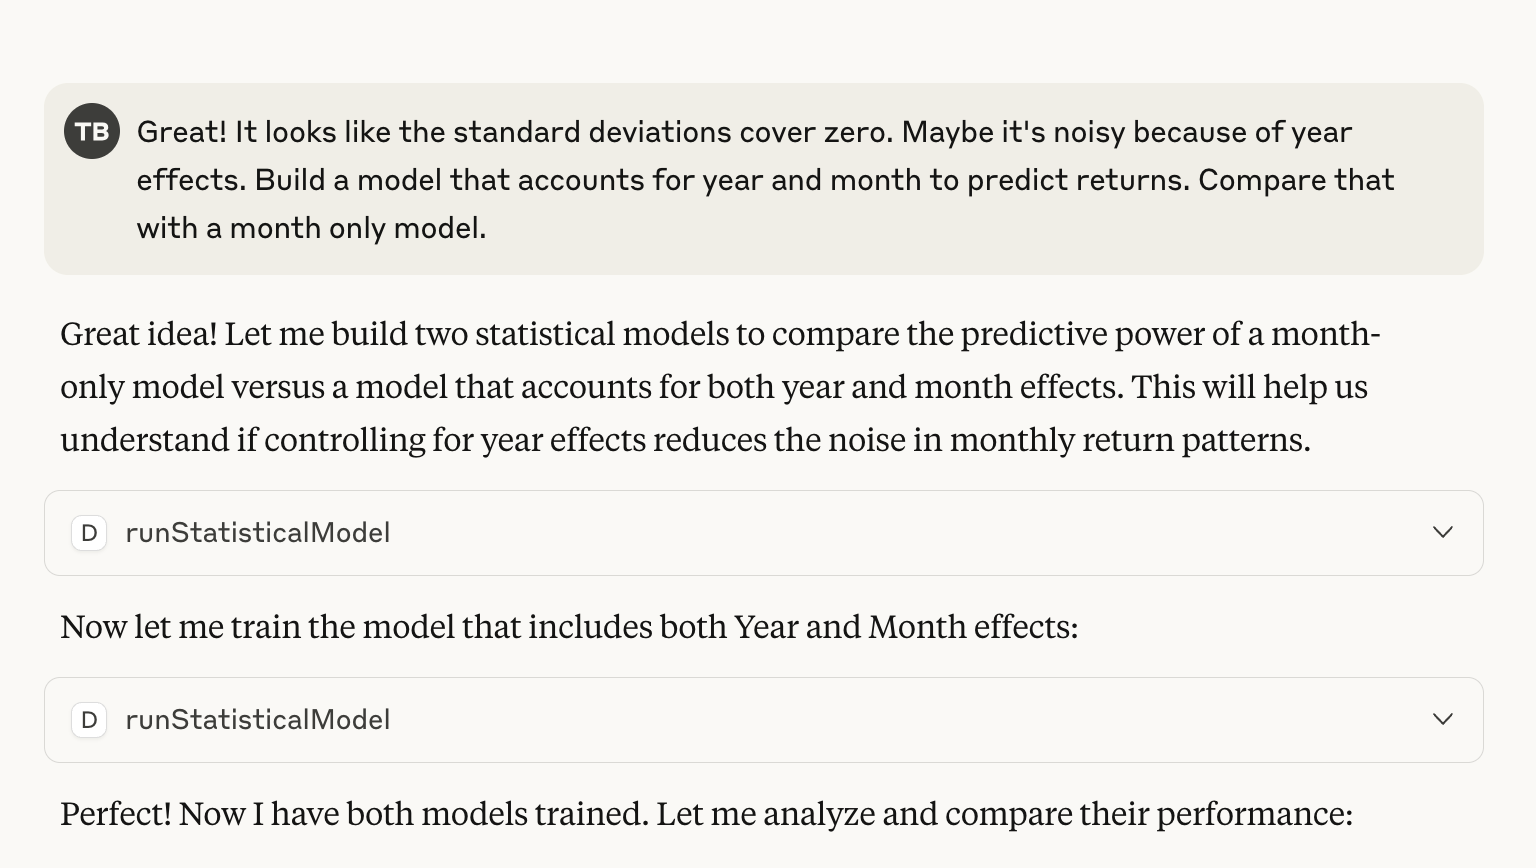
Daggy built two models: one estimating the month effect and the other adjusting for the year when estimating the month effect. Although July's estimate was slightly positive, it was not statistically significant in either model. But maybe we have some "reversion to the mean", where strong months tend to be followed by weak months and vice-versa? Perhaps this washes out the month effect? Claude knew how to frame this question to Daggy as a "lagged dependent variable" then included it in its analysis. Although the analysis showed apparent mean reversion, with strong months followed by weaker months, July's impact remained small and statistically insignificant. We asked claude to account for linear and cubic time trends. This eliminated mean reversion, but July remained weak.
Overall, Daggy trained 8 models. I then asked Claude which model was the "best" and how well they performed, it then returned the table below:
Model Performance Summary
| Rank | Model | WAIC | R² | Key Features | Winner? |
|---|---|---|---|---|---|
| 🏆 1 | Month Only | -262.86 | 8.8% | Seasonal effects only | ✅ BEST |
| 2 | Pure Mean Reversion | -265.89 | 0.8% | Lagged return only | ❌ |
| 3 | Month + Mean Reversion | -269.40 | 11.7% | Seasonal + lag effects | ❌ |
| 4 | Month + Year (Categorical) | -273.77 | 15.3% | Seasonal + year dummies | ❌ |
| 5 | Month + Year (Continuous) | -274.58 | 8.6% | Seasonal + linear year | ❌ |
| 6 | Time Trends Only | -275.35 | 17.6% | Linear/quadratic/cubic time | ❌ |
| 7 | Month + Year + Mean Reversion | -276.45 | 18.1% | Full model with years | ❌ |
| 8 | Time + Mean Reversion | -341.20 | 20.3% | Time trends + lag | ❌ |
The table shows that no model fit the data particularly well.1 The best model by WAIC, which estimates out of sample performance, included only month effects. But its R-squared was just 8.8%, meaning more than 90 percent of the variation in the training data remained unexplained.
The table below shows the estimates for July across several models. The coefficients show July's estimated deviation from the average monthly returns.
July Effect Analysis
| Model | July Coefficient | 95% Confidence Interval | Statistically Significant? |
|---|---|---|---|
| Month Only | -0.009 | [-0.343, +0.303] | ❌ NO |
| Month + Year Dummies | -0.076 | [-0.309, +0.146] | ❌ NO |
| Month + Mean Reversion | -0.052 | [-0.295, +0.224] | ❌ NO |
| Month + Time Trends + Mean Reversion | -0.068 | [-0.253, +0.118] | ❌ NO |
The table shows we are unlikely to have any investing opportunities in July.
Conclusion
Although our lunch neighbor had the wrong take about July, he wouldn't have done much better had he looked at the raw data alone. Daggy's statistical analysis showed that July's strength over the past 15 years is typical given random variation of the S&P 500's overall trend. We built and analyzed several models all showing that time-related factors failed to even predict the training data well. If they can only moderately predict the training data, they will struggle even more to predict the future.
Footnotes
-
WAIC (Widely Applicable, or Watanabe-Akaike, information criterion) estimates how well the model will predict on out of sample data, with values closer to zero being better. R-squared estimates how much of the training data's variation the model explains. High R-squared values won't typically travel to new data. ↩